Matplotlib:刻度线密度设置
需要导入:from matplotlib.ticker import MultipleLocator, FormatStrFormatter模块
MultipleLocator 设置刻度的密度
FormatStrFormatter 设置刻度标签的格式
主刻度:(y轴同理)
倍数:ax.xaxis.set_major_locator(MultipleLocator(倍数))
文本格式:ax.xaxis.set_major_formatter(FormatStrFormatter(’%占位数.小数点数f’))
副刻度:(将"major"改为"minor"即可)
倍数:ax.xaxis.set_minor_locator(MultipleLocator(倍数))
文本格式:ax.xaxis.set_minor_formatter(FormatStrFormatter(’%占位数.小数点数f’))
# 导入模块
import matplotlib.pyplot as plt
from matplotlib.ticker import MultipleLocator, FormatStrFormatter
import numpy as np
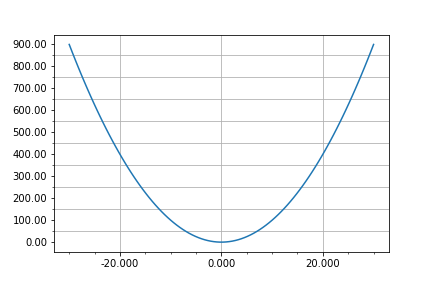
# 数据
x = np.linspace(-30, 30, 100)
y = x**2
# 绘图
plt.plot(x, y)
ax = plt.gca()
# 设置轴的主刻度
# x轴
ax.xaxis.set_major_locator(MultipleLocator(20)) # 设置20倍数
ax.xaxis.set_major_formatter(FormatStrFormatter('%5.3f')) # 设置文本格式
# y轴
ax.yaxis.set_major_locator(MultipleLocator(100)) # 设置100倍数
ax.yaxis.set_major_formatter(FormatStrFormatter('%1.2f')) # 设置文本格式
# 设置轴的副刻度
# x轴
ax.xaxis.set_minor_locator(MultipleLocator(5)) # 设置10倍数
# ax.xaxis.set_minor_formatter(FormatStrFormatter('%2.1f')) # 设置文本格式
# y轴
ax.yaxis.set_minor_locator(MultipleLocator(50)) # 设置50倍数
# ax.yaxis.set_minor_formatter(FormatStrFormatter('%1.0f')) # 设置文本格式
# 设置网格
ax.xaxis.grid(True, which='major') # x坐标轴的网格使用主刻度
ax.yaxis.grid(True, which='minor') # y坐标轴的网格使用次刻度
# 展示
plt.savefig('11.png')